Koh Phangan Weather
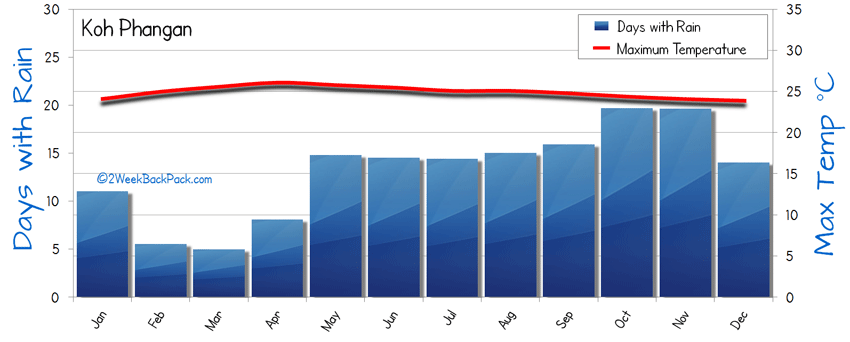
The following Koh Phangan (or Ko Pha Ngan) weather charts displays the average conditions on the island. The first chart displays the day time maximum temperature verses the number of wet days per month.
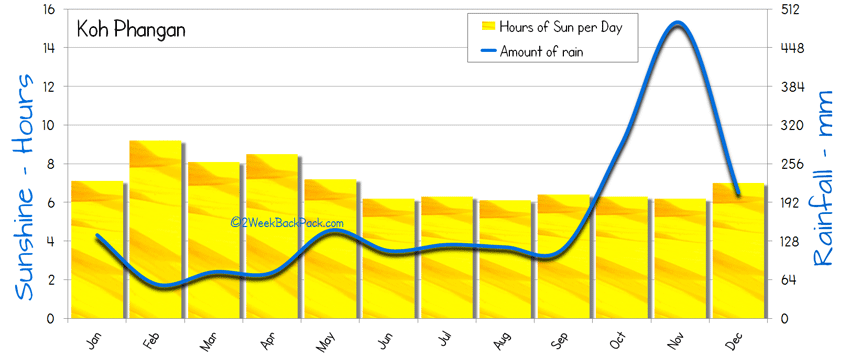
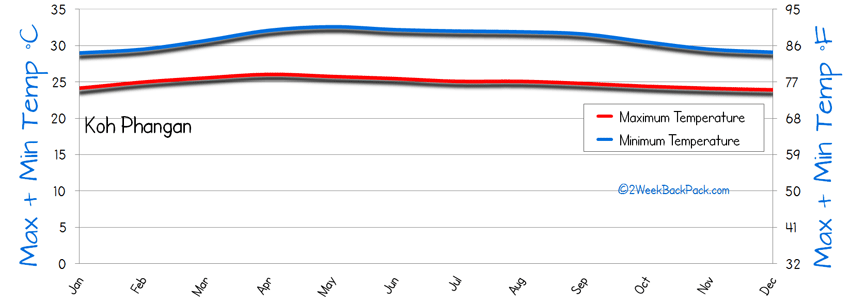
The second chart indicates the amount of sunshine per day compared to the amount of rain that falls on for Koh Phangan. The third chart shows the maximum and minimum temperatures of Ko Pha Ngan. For a guide on when to visit Ko Pha Ngan please click here.
Koh Phangan Weather Chart

Average Weather Conditions for Koh Phangan
Sunshine and Rainfall for Koh Phangan

The average hours of sunshine per day verses the amount of rainfall for Koh Phangan
Koh Phangan Temperature

The maximum and minimum temperature of Koh Phangan in centigrade and fahrenheit.
The weather chart data for Koh Phangan has been averaged over the month and is based on data collected over the previous 15 years. The weather chart of Koh Phangan is based on averages and is provided to aid tourists and visitors to choose the most suitable time of the year to visit Koh Phangan. As the Koh Phangan weather chart is based on averages there can always be the chance of extremes or freak weather.
Guide to Koh Phangan Navigation
Koh Phangan Travel Guide Navigation
2WeekBackPack.com, with over 250 pages of travel ideas, if it's not here it's probably not in Koh Phangan


